Spot and contract rates on major ocean trade lanes are rising as US retailers boost their import forecasts for the first half of 2024 and container volumes increase amid shipping diversions and delays. But it's not clear whether current conditions will roll into the second half of the year, especially as imports alone haven't been enough to spark a major shift in either the ocean or surface transportation freight markets.
Despite some “green shoots” in manufacturing, the US freight economy outlook for the second half of 2024 is still cloudy. Any improvements are likely to be gradual, not sudden.
That means shippers will have another year of pricing power over North American trucking and intermodal rail. On the ocean, the tide may have begun to shift, but it’s unclear whether first-half pricing and volume increases will have second-half staying power.
There’s no clear timeline as to when the attacks on shipping in the Red Sea may end, but capacity is being repositioned and new capacity is entering the market.
Several large US retailers in April signed 2024–25 service contracts for the eastbound trans-Pacific at rates that are about 12% to 17% higher than the 2023–24 deals, industry sources say. They add that mid-size US importers who haven’t finalized 2024–2025 service contracts risk shipping at spot rates that are about two and one-half times the prevailing contract rates.
Spot rates in the eastbound trans-Pacific are set to increase more than $1,000 per FEU based on May 1 general rate increases (GRIs) filed last month by most of the ocean carriers. Carriers and non-vessel-operating common carriers (NVOs) expect the rate hikes to stick in the short term as vessels leaving Asia are forecast to be full well into May.
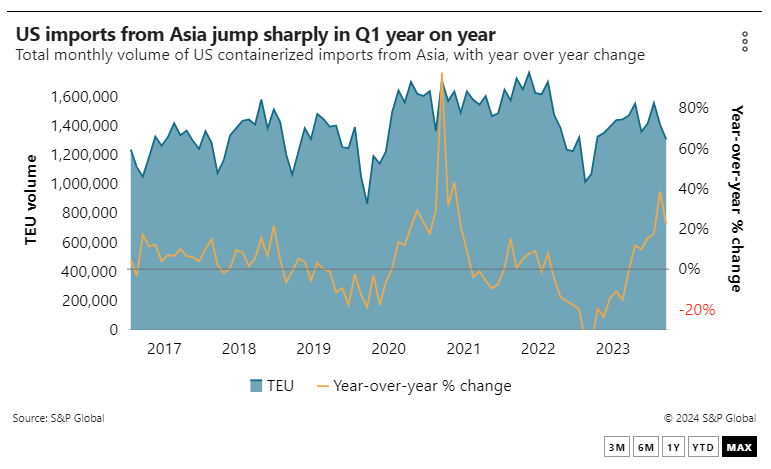
First-half containerized US imports are expected to total 11.7 million TEUs, an 11% year-over-year increase, according to the monthly Global Port Tracker produced by the National Retail Federation (NRF) and Hackett Associates. US imports rose 8.3% in January and 26.4% in February, said the NRF, which expects annualized gains through August.

That’s a stiff tailwind after a 12.9% drop in total US containerized imports in 2023 to 24 million TEUs, according to data from PIERS, a sister product of the Journal of Commerce within S&P Global. In 2022, imports rose only 0.1%, as shippers slashed orders in the second half after front-loading imports into the first half of the year.
Watching retail movements
The increase in imports in recent months doesn’t necessarily mean the US retail economy is shifting to a higher gear. As in other years — most notably 2022 — importers may be pulling some goods forward to mitigate peak season risk. In 2022, West Coast labor talks were the concern. This year it’s East Coast labor talks and attacks on Red Sea shipping.
The pull-forward may be augmented by some inventory restocking after inventories were widely slashed in 2023 following the early-order rush of 2022. US business inventories were up 1% year over year in February, the last month for which US Census Bureau data is available. Retail inventories were up 5.6% year over year in February at $808.7 billion.
And consumers are buying more. US retail sales rose 3.9% in March from a year ago to $613.9 billion, according to the US Census Bureau. From January through March, retail sales rose 1.9%. The seasonally adjusted month-to-month increase from February to March was 0.7%.
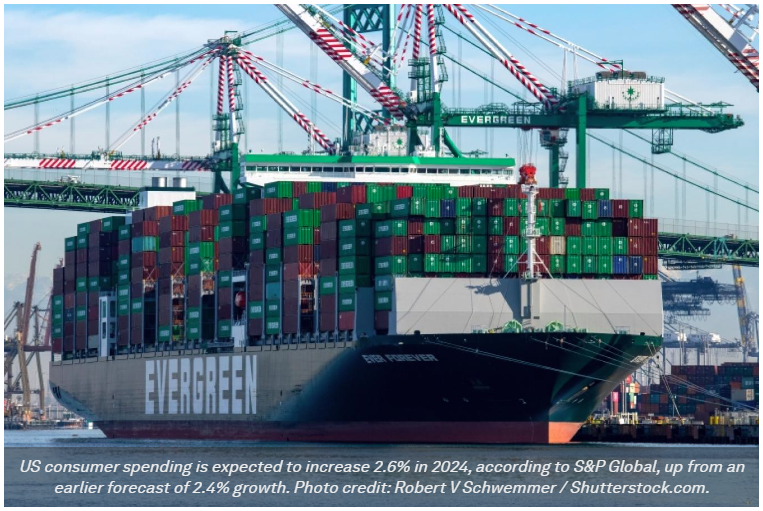
Consumer spending is forecast to increase 2.6% in 2024, according to S&P Global, parent company of the Journal of Commerce. That’s higher than S&P Global’s previous forecast of 2.4% for the year, thanks to stronger-than-expected equity values at the end of the first quarter, coupled with continued low unemployment and a faster rate of immigration.
US imports overall should grow 4.8% this year in terms of dollar value to more than $4 trillion, after falling 1.7% in 2023, according to S&P Global’s April US economic forecast. The dollar value of exports of goods is expected to rise 3.2% to $3.2 trillion, according to the forecast. That’s a downgrade from an earlier projection of 3.9% growth in 2024.
A ‘broadening effect’
Maersk has noted increases in ocean cargo demand in several regions, with its Asia-North America volume up nearly 28% from a year ago in the first quarter, the company said May 2. Demand on the Asia-to-Europe trade route rose 9% from a year ago, while Latin American demand was up 22% and West Africa volumes 18%.
“You’re seeing trade flows significantly up year on year, and that is exacerbating the shortage of capacity” in some trade lanes, Maersk CEO Vincent Clerc said during the carrier’s quarterly earnings call. Unseasonal demand had a “broadening effect” in terms of rate increases in trade lanes not directly affected by Red Sea attacks, Clerc said.
That will have a positive impact on spot pricing — for ocean carriers at least — in the second quarter “and possibly the third quarter as well,” he said. “What we see so far is at least a better second quarter, the fourth quarter being the most challenging one and ... the third being a bit of a transition between the two,” Clerc told investment analysts.
The “broadening effect” Clerc cites is showing up in the trans-Pacific trade. Container spot rates from North Asia to the US climbed steadily in late 2023 amid attacks on shipping in the Red Sea and then dropped from February through April. But current rates are up by triple digits on a year-over-year basis, according to Platts, a sister company of the Journal of Commerce within S&P Global.
Spot rates of $4,000 per FEU in the week ending May 3 for North Asia to the US West Coast were up 42% from the previous week and 183% year over year, according to Platts. Spot rates from North Asia to the East Coast, including freight routed away from the Red Sea, were up 102% year over year and 46% from the previous week at $4,860 per FEU.
Higher eastbound trans-Pacific volumes reportedly are causing rail container backlogs at some marine terminals at the ports of Los Angeles and Long Beach, driving an increase in eastbound intermodal train movements and worsening a deficit of westbound railcars.
Union Pacific Railroad and BNSF Railway are increasing railcar supplies in Southern California in anticipation of a stronger peak shipping season in August. Rail container dwell times on the Los Angeles-Long Beach terminals have increased steadily this year, from 4.2 days in January to 7.02 days in March, according to the Pacific Merchant Shipping Association.
Lacking a catalyst
But gains in US imports aren’t enough to float all boats. US truckload and less-than-truckload (LTL) markets remain soft, with excess capacity and depressed demand.
The consensus is that a stronger catalyst of some type is needed to boost US freight demand, which has remained depressed despite an expanding US economy that dodged a recession in 2023. But the ingredients for market change haven’t come together yet. It’s unclear whether they will come together in the back half of the year or in 2024 at all.
“I’m not seeing that catalyst right at the moment,” Jason Miller, a professor and interim chairperson of the Department of Supply Chain Management at Michigan State University, told the Journal of Commerce. Neither imports, interest rates, manufacturing output, or housing starts and construction are where they need to be, said Miller.
“Imports are a very small fraction of actual spending and actual freight,” he said. “Year-over-year import growth by itself isn’t going to ensure a strong truckload market.”

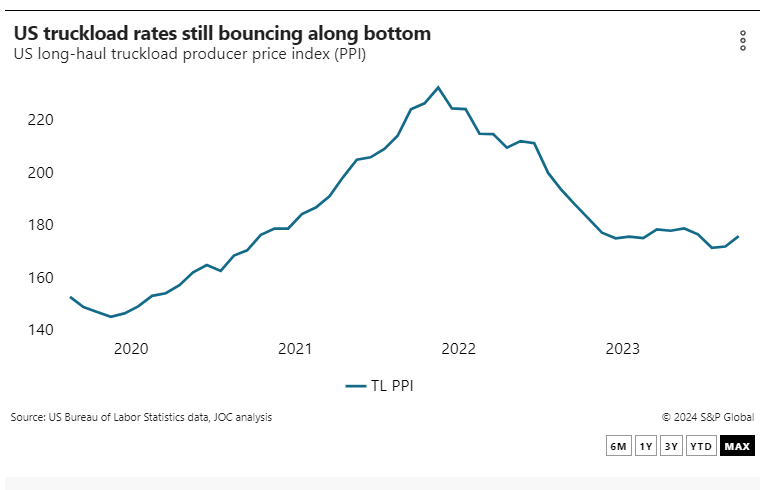
US truckload rates, as measured by the US long-distance truckload producer price index (PPI), were down 6.5% year over year in March, and about 24% lower than their May 2022 peak, data from the US Bureau of Labor Statistics shows. The PPI is a measure of all-inclusive rates, both contract and spot. The truckload PPI has been relatively flat since last June.
In contrast, LTL rates bounced off their bottom last year and continue to rise, thanks to the collapse of Yellow, once the third-largest LTL provider. Yellow’s exit reduced LTL capacity by about 10%, according to transportation research firm SJ Consulting Group. The long-distance LTL PPI in March was up 6.4% from last July and 2.5% year over year.
Even LTL’s gains are limited by market softness. Rates have climbed not because of stronger demand but limited capacity, as is clear from SJ Consulting Group’s analyses of volumes among the top 40 LTL trucking companies. Yellow’s freight has been reallocated and absorbed by competitors, but there’s little, if any, “new” freight hitting the market.
When that new freight arrives, it most likely will come from strong US manufacturing output, said Miller, who’s also a Journal of Commerce analyst.
“Most trucking freight is generated by domestic manufacturing plants,” he said, citing the US Commodity Flow Survey. “The PMI [purchasing managers index] data was looking better and then April came in a little weaker.”
In April, the Institute for Supply Management (ISM) US manufacturing PMI dropped to 49.2 from 50.3 in March. Any reading below 50 indicates contraction. The ISM index had only turned to expansion in March. S&P Global’s US manufacturing PMI, which had been in expansion territory since January, dropped to a neutral reading of 50 in April.
The drop came as new orders for US manufacturers fell for the first time since December. The ISM PMI New Orders Index for April dropped from 51.4 to 49.1. S&P Global’s April PMI also noted a modest decrease in new orders.
“In 2017 and 2018, we were getting new order readings in the high 50s and low 60s,” Miller said. “Today’s PMI is not providing anything promising.”

